Center of Gravity and Contour Shape Measurement
Film-type pressure sensors are used for measuring pressure. Measured values can be converted to absolute unit values (mbar, Hg, Kgf/cm², etc.). However, variations may occur depending on usage conditions such as temperature, humidity, frequency of use, and pressing direction, so this should be considered during use.
Due to unpredictable variations caused by external conditions, these sensors are much more suitable for relative comparison rather than absolute unit measurements.
Heatmap Visualization
The following examples demonstrate how to convert sensor measurements into heatmaps.

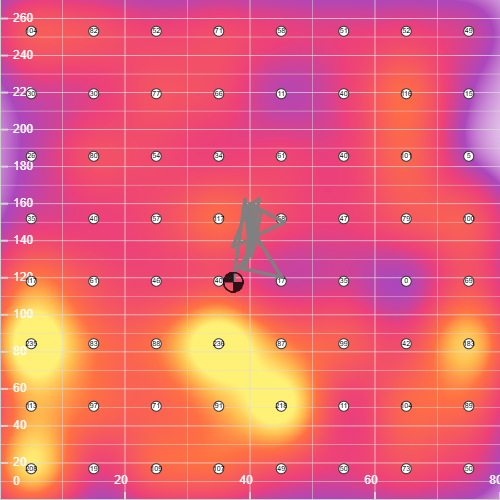
Relative pressure comparison is possible within the area where sensors are placed. This allows you to identify which areas are pressed more or less. By determining the center of gravity coordinates, you can identify whether weight/force is biased to one side.
Use Cases
Body Pressure Measurement (Cushions, Beds, Plantar Pressure)
- Detecting left/right bias in sitting posture
- Analyzing tossing and turning patterns during sleep
- Analyzing gait patterns through plantar pressure distribution
- Posture correction feedback systems
Industrial Pressure Monitoring
- Inspecting pressure uniformity in press machines
- Verifying mold alignment status
- Alarm settings when deviation exceeds ±10%
- Identifying machine structural deformation and pressure setting errors
Touch/Gesture Recognition
- Real-time contact position tracking
- Multi-touch detection capability
- Gesture differentiation based on pressure intensity
Contour Measurement
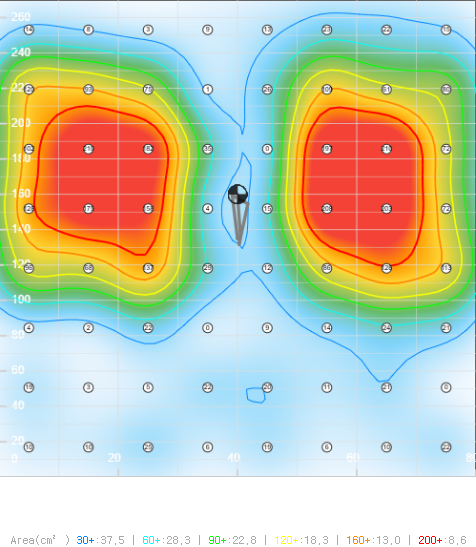
Using dedicated software with interpolation matching, the following can be identified:
Pressure Zone Shape (Contours)
- Useful when users attempt visual image-based machine learning rather than numerical data
- Useful for identifying deviation and trends in pressing machines
Pressure Zone Area
- Area can be calculated for each pressure range.
- Useful for setting a specific threshold as a trigger
- When pressure is applied periodically, useful for identifying peak points of maximum/minimum pressure
- Example 1) Calculate the area where measured values are between 50-80.
- Example 2) Detect when the area with measured values above 30 exceeds 50cm².
- Example 3) At peak area, measure the maximum pressure point location and pressure amount.
Measurement Precautions
- Dead zones: Areas between sensor cells cannot be measured. Only estimation through interpolation is possible
- Absolute accuracy: Trust only for relative comparison. Load cells are recommended for precise unit-based measurements
- Interpolated values: Consider that interpolation results displayed in heatmaps are estimates, not actual values
- Techniques used in heatmaps: Gaussian interpolation, Marching Squares. 'Interpolation' produces estimated values, not actual values. Please use with this in mind.