Force-Resistance Graph
Force-Resistance Relationship
Resistance output is inversely proportional to applied pressure.
Below is an example graph showing the relationship between sensor pressure and resistance values. The blue line represents the resistance curve. The red line represents the inverse of resistance, which corresponds to the ADC terminal output.
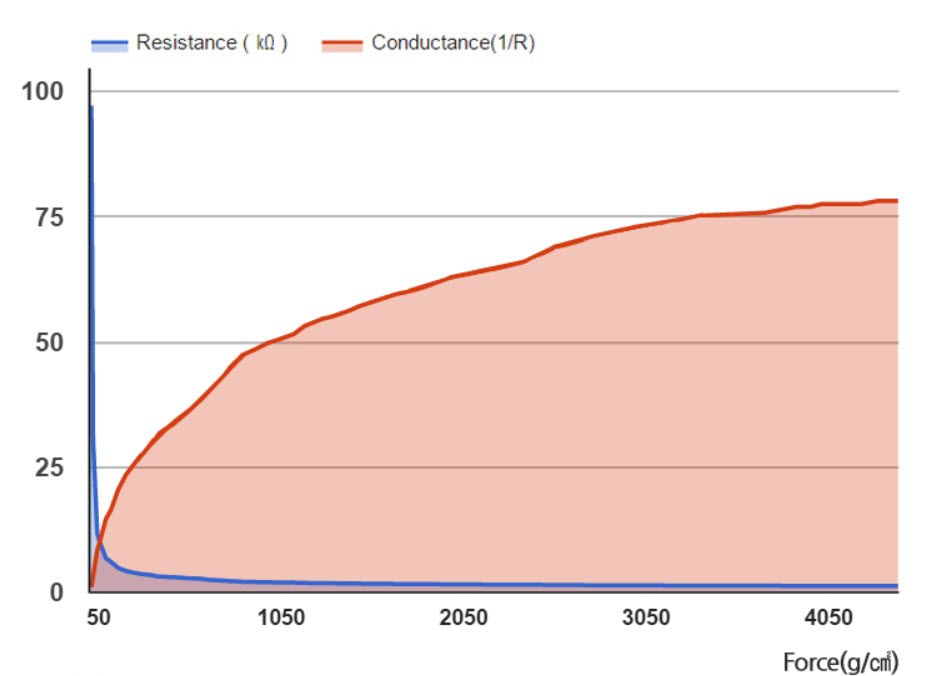
[▲ FSR sensor output variation by pressure level]
Measurement Range Specifications of FSR Sensors
Sensors on the market have both wide and narrow measurement ranges. A wider measurement range is not necessarily better—choose according to your application.
A) Measurement Range and Sensor Resolution are Inversely Related
Generally, a wider sensing range results in greater deviation.
- Narrow measurement range: Higher resolution with less deviation.
- Wide measurement range: Lower resolution with greater deviation.
B) Primary Measurement Zone is Below Half of the Total Range
The sensor output graph is not linear.
- Low load range: High slope → High resolution.
- High load range: Low slope → Low resolution.
- Higher resolution = Better differentiation of small force differences.
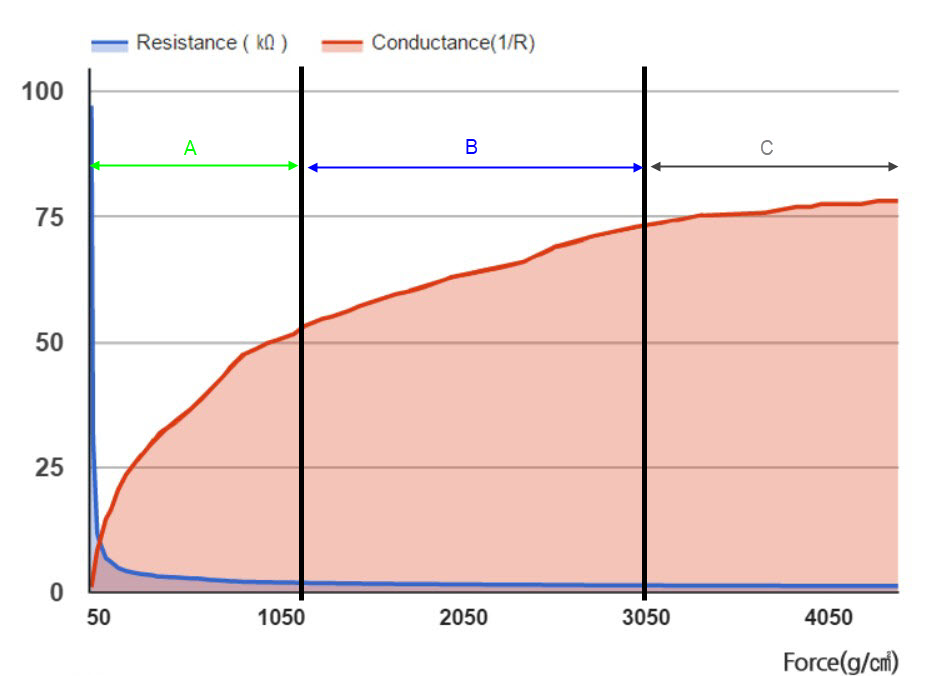
[▲ FSR sensor output variation by pressure level]
In the graph above, Zone A has high resolution, while Zone C has low resolution.
It is recommended to position your sensor so that your 'frequently measured load values' fall within Zone A or B. This can be achieved through sensor sensitivity adjustment and exterior material selection.